
| September 3, 2026 | No.209 |
August 2026
(Back Issues Here)
We had 5.90 inches of rain at the Palmira Arriba Station during the month of August 2026.
Rainfall for August 2026 |
|||
Area |
Contributors |
August 2026 |
Total 2026 |
| El Salto Arriba | Beth Corwin | 6.27 | 25.16 |
| Los Cabazos | Don Hughes | 9.93 | 32.97 |
Jaramillo Arriba |
Steve Sarner |
n/a | n/a |
| Jaramillo Alto | Steve White | 7.87 | n/a |
| Jaramillo Central | Colleen Anderson | 6.15 | 29.13 |
Jaramillo Abajo |
John McGann |
6.79 | 43.38 |
| Palo Alto | Nancy Pettersen | 17.34 | 84.20 |
| Valle Escondido | Gisela Remsen | 7.39 | 31.63 |
| Brisas Boquetenas | Dennis Decorte | 14.54 | 72.44 |
| Brisas Boquetenas | Richard Sturtz | n/a | n/a |
Cerro Verde (Volcancito) |
Charlotte Lintz |
5.97 | 30.06 |
| Canyon Village | Denise McGhee | 7.31 | n/a |
| Caldera | Chris McCall | 5.27 | 37.68 |
| Palmira Abajo | Dave Nichols | 6.09 | 39.39 |
Palmira Arriba |
Lloyd Cripe |
5.90 | 33.65 |
| N/A = Not
Available Red = Highest rainfalls Green = Lowest rainfall |
|||
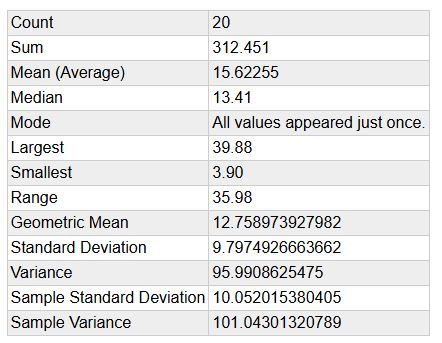
Checking the past data from the Palmira Arriba Station over a span of 20 years, the average rainfall for the months of August is 15.62 inches. The range is a low of 3.90 inches (2014) to a high of 35.98 inches (2008). This month's 5.90 inches at the Palmira Arriba Station is -1 standard deviations below the mean for the months of August. This is statistically lower than normal. It was a statistically drier than normal during the month of August.
Palmira Arriba Station Average August Rainfalls over 20 Years
At the Palmira Arriba Station we had 22 days with measureable precipitation and 9 days without any precipitation.
The average winds in August 2026 at the Palmira Arriba station was 4.74 mph and generally from the NNE. Our maximum wind was 27.5 mph. Average temperature was 71.56 degrees F. The Highest temperature was 84.4 degrees F. The lowest temperature was 63.0 degrees F. You can check all the previous data for the months of August at this climate link.
In the Rainfall Table above note the variations in August rainfall in the different areas of the District of Boquete. A general inspection indicates generally low rain rates throughout the District. The highest rates were in Palo Alto (17.34 inches) reported by Nancy Pettersen and at Brisas Boquetenas (14.54 inches) reported by Dennis Decorte. The lowest rate was reported by Chris McCall at Caldera (5.27).
The latest ENSO Cycle Report is saying that "El Niño is present. Equatorial sea surface temperatures (SSTs) are above average across the eastcentral and eastern Pacific Ocean. The atmospheric circulation anomalies over the equatorial Pacific Ocean are consistent with El Niño. El Niño is strengthening, with a greater than 90% chance of a very strong event during the Northern Hemisphere fall and winter 2026-27."
For more information about El Niño and how it affects our weather see Boquete Weather Watcher Update No. 207.
The IRI (International Research Institute for Climate and Society) (select South America from the Region menu) is predicting a 40% to 60% probability of below normal precipitation in Panama during the months of September-October-November 2026. (Yellow to Brown areas).
.png)
IMHPA (Instituto de Meteorología e Hidrología de Panamá) Documents Section predicts that during September 2026 "...Accumulated rainfall for this month is expected to be near to below normal across much of the Pacific and Western Caribbean slopes. However, above-normal rainfall is expected in some areas of the province of Colón and parts of Darién. For the rest of the country, rainfall values are expected to be within the climatological range." You can read their entire report and check out the details in the "documents" section at this link.
There are considerable extreme weather events occurring around the world. These events are most probably linked to climate change affecting the weather. On August 26 there was an avalanche and flood catastrophe in Nepal that destroyed villages and caused many deaths. This was probably caused by the warming of a glacier that collapsed related to climate change and increased temperatures. I recommend reading this article by Bob Hensen at the Yale Climate Connection to understand how this happened and the links to climate change. An amazing calamity was captured on videos.
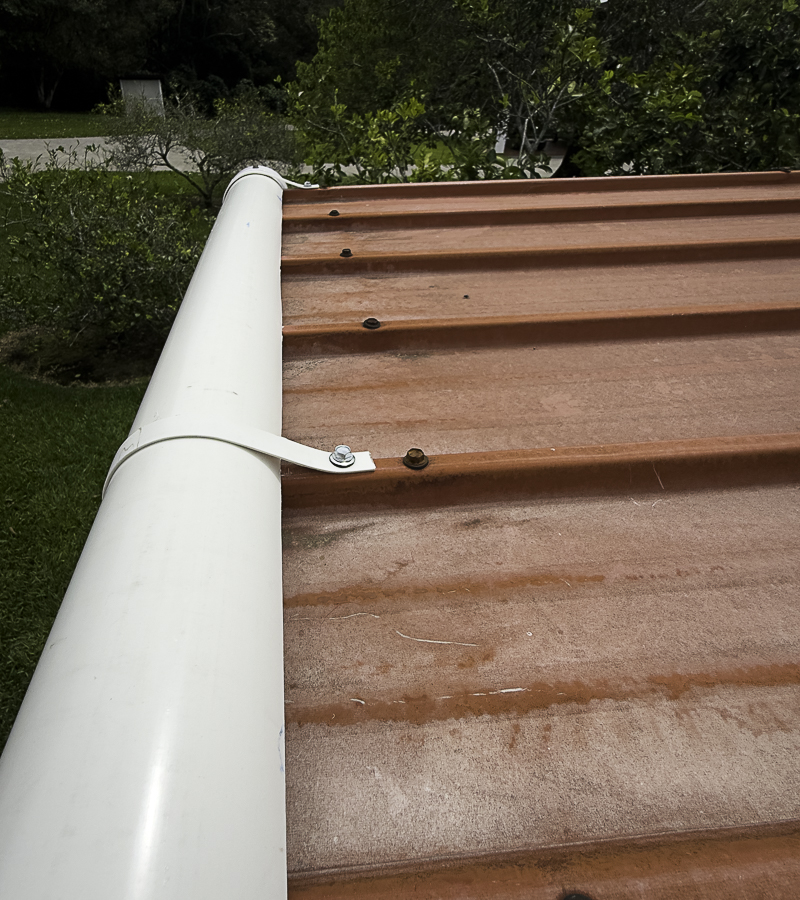
Because of the lower rainfall this season, we decided to experiment with water catchment of rain water to use for irrigation of some fruit trees and ornamentals. Our coffee shed has a sloping shed type roof that is about 1500 square feet. There was no gutter on the low end of the slope. If we installed a gutter it would collect a lot of water that could be funneled into a storage tank. I used a 4 inch PVC pipe to make the gutter by cutting out a 1 inch strip the length of the pipes. This opening slid over the edge of the roof and was secured in place with pieces of the 1 inch strip cut from the pipe. The water from the gutter tube was plumbed into a 415 gallon water tank. The tank has an overflow pipe the same size as the catchment into the tank so water can overflow when necessary. Here are some photos of the setup:
4 inch PVC Pipe Gutter
Rain Catchment 415 gallon Tank Setup
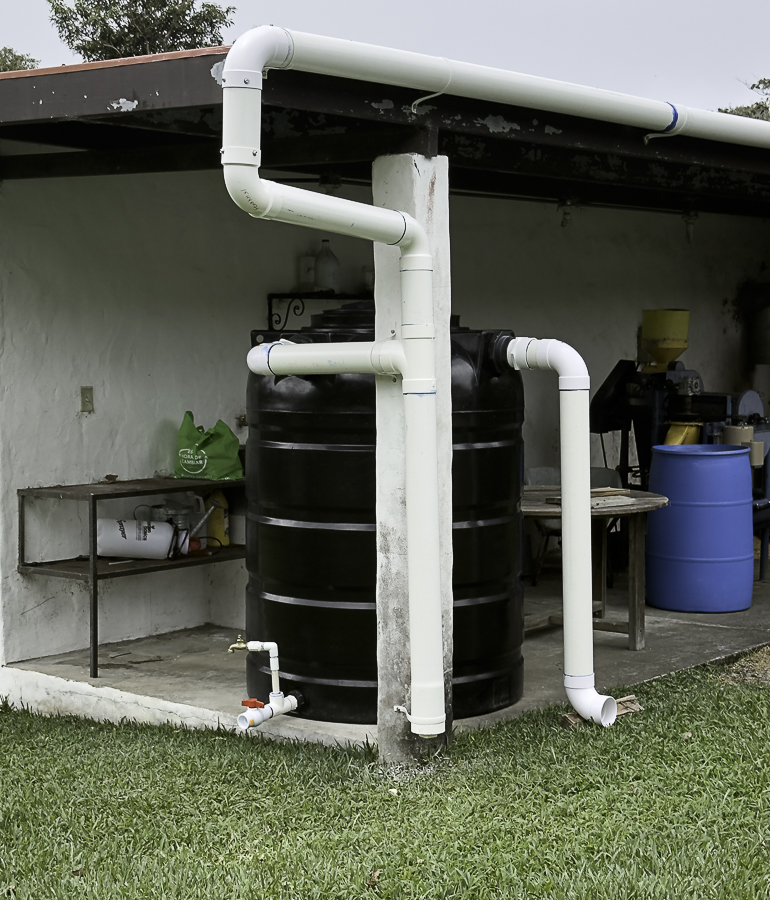
After all of this was installed we waited for some rain. Eventually we got a day with an 1/8 inch of rain. This gave the tank 112.5 gallons of water. 2 days later it rained 1/2 of an inch and completely filled the tank to overflow. Catchment calculators online indicted that 1/2 of an inch of rain coming off a 1500 square foot roof should harvest 450 gallons of rain water. It did that and more.
It is amazing how much water flows off roofs when it rains. If it is caught and stored it is a significant source of water. For some parts of the world rain catchment is their only source of water.
September may bring more or less rain but only time will tell. For insurance keep the umbrellas handy.
Lloyd Cripe