| July 3, 2026 | No.207 |
June 2026
(Back Issues Here)
We had 8.16 inches of rain at the Palmira Arriba Station during the month of June 2026.
Rainfall for June 2026 |
|||
Area |
Contributors |
June 2026 |
Total 2026 |
| El Salto Arriba | Beth Corwin | 8.43 | 15.16 |
| Los Cabazos | Don Hughes | 5.72 | 15.88 |
Jaramillo Arriba |
Steve Sarner |
n/a | n/a |
| Jaramillo Alto | Steve White | 6.21 | n/a |
| Jaramillo Central | Colleen Anderson | 6.17 | 18.17 |
Jaramillo Abajo |
John McGann |
10.44 | 31.75 |
| Palo Alto | Nancy Pettersen | 10.93 | 52.67 |
| Valle Escondido | Gisela Remsen | 7.16 | 18.86 |
| Brisas Boquetenas | Dennis Decorte | 21.94 | 49.55 |
| Brisas Boquetenas | Richard Sturtz | 22.11 | 57.60 |
Cerro Verde (Volcancito) |
Charlotte Lintz |
10.72 | n/a |
| Canyon Village | Denise McGhee | 9.47 | n/a |
| Caldera | Chris McCall | 16.67 | 27.85 |
| Lucero | Mike Joy | 11.24 | 27.56 |
| Palmira Abajo | Dave Nichols | 11.57 | 27.31 |
Palmira Arriba |
Lloyd Cripe |
8.16 | 22.92 |
| N/A = Not
Available Red = Highest rainfalls Green = Lowest rainfall |
|||
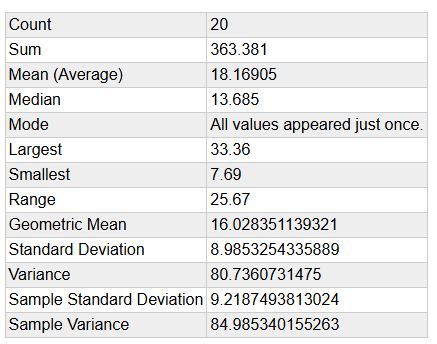
Checking the past data from the Palmira Arriba Station over a span of 20 years, the average rainfall for the months of June is 18.16 inches. The range is a low of 7.69 inches (2013) to a high of 33.36 inches (2022). This month's 8.16 inches at the Palmira Arriba Station is -1.11 standard deviations below the mean for the months of June. This is statistically lower than normal. It was a statistically drier than normal month.
Palmira Arriba Station Average June Rainfalls over 20 Years
At the Palmira Arriba Station we had 17 days with measureable light precipitation and 13 days without precipitation.
The average winds in June 2026 at the Palmira Arriba station was 1.82 mph and generally from the NNE. Our maximum wind was 22.0 mph. Average temperature was 69.54 degrees F. The Highest temperature was 85.6 degrees F. The lowest temperature was 59.9 degrees F. You can check all the previous data for the months of May at this climate link.
In the Rainfall Table above note the variations in June rainfall in the different areas of the District of Boquete. A general inspection indicates generally low rain rates throughout the District of Boquete but there were highist rates in Brisas Boquetenas reported by Richard Sturtz and Dennis Decorte.
The latest ENSO Cycle Report is saying that "El Niño conditions are present. Equatorial sea surface temperatures (SSTs) are above average across the central and eastern Pacific Ocean. The atmospheric circulation anomalies over the equatorial Pacific Ocean are consistent with El Niño. El Niño conditions are expected to strengthen into the Northern Hemisphere winter 2026-27."
There has been some talk in the news of a likely Super El Niño occurring this year. I asked Gemini AI what that means? Here is the response:
A "Super El Niño" is an informal, popular term used to describe a very strong El Niño event.
While forecasters like the US National Oceanic and Atmospheric Administration (NOAA) do not use "Super El Niño" as an official technical classification, they identify El Niño strength based on how much ocean temperatures rise above normal:
-
El Niño Baseline: Sea surface temperatures in the central and eastern Pacific Ocean (specifically the Niño 3.4 region) must exceed the long-term average by at least 0.5°C (0.9°F) for five consecutive, overlapping three-month periods.
-
Strong El Niño: Ocean temperatures reach at least 1.5°C above average.
-
Very Strong El Niño ("Super" El Niño): Ocean temperatures climb to at least 2.0°C above the long-term average.
Why It Matters
Very strong El Niño events are rare—there have only been a handful since 1950, with the last major one occurring in 2015–2016. When an event reaches this magnitude, the likelihood of extreme global weather increases significantly, often triggering severe droughts, intense wildfires, and massive flooding across different continents, while pushing global temperatures to record highs.
How would a very strong El Niño affect our weather? I was asked by some to explain what El Niño is and how a very strong El Niño would affect our weather. In the past I posted links to explanations of El Niño in the monthly updates, but since few accessed, them I took them off the updates.
El Niño is a tedious phenomenon to study and understand. It takes time and effort that many are not williing to give. Recently, a sailor friend put me onto a good video that explains El Niño. I suggest that if interested, take 35+ minutes to watch it. It is a good short understandable presentation.
You can then do a search for other videos and articles that explain El Niño. At YouTube search for "Understanding el Niño and la Nina." A variety of videos are available. Also do an AI Search asking "how a strong El Niño affects Central America" or more specifically affects Panama? Also the IMHPA (Instituto de Meteorología e Hidrología de Panamá) has some information in Spanish regarding how El Niño effects Panama weather and climate. If your Spanish is weak, use an online translator to read in English.
The IRI (International Research Institute for Climate and Society) (select South America from the Region menu) is predicting a 40% to 60% probability of below normal precipitation in Panama during the months of July-August-September 2026. (Brown areas).
.jpg)
IMHPA (Instituto de Meteorología e Hidrología de Panamá) Documents Section predicts that during June 2026 "...Rainfall totals for this month are expected to decrease. Across much of the country, rainfall is forecast to be near or below normal, while above-normal rainfall is expected in some areas of Bocas del Toro province, northern Veraguas, and southern Darién." You can read their entire report and check out the details in the "documents" section at this link.
There is a new impressive website online regarding weather and climate that you should know about, Climate.us. Check out its contents and also find out why it was started. I think this is going to be an important place to visit to keep up with Climate Change.
I was concerned this June that our rainfall was too low and our well might go dry. We need water for people and plants. However, Our coffee plants look nice and green with many green cherries coming alone despite the low rainfall. Thankfully the well is not dry and we have adequate water for drinking, cooking and bathing. July seems to be starting out with more rain so maybe we will do okay.
Fortunately, our umbrellas have rested and are sitting at attention ready to go to war if heavier rains appear on the battle field. Life is at times challenging, but still generally good here in Paradise.
Lloyd Cripe