| August 4, 2020 | No.136 |
July 2020
(Back Issues Here)
We had 14.21 inches of rain at the Palmira Station in July of 2020. The reports from around the District of Boquete for July generally indicate significant rain as expected for this phase of our rainy season.
Rainfall for July 2020 |
|||
Area |
Contributors |
July 2020 |
Total 2020 |
El Santuario |
Terry Zach |
2.95 | 31.30 |
Jaramillo Arriba |
Steve Sarner |
12.44 | 71.28 |
Jaramillo Abajo |
Don Berkowitz |
17.78 | 89.98 |
Jaramillo Abajo |
Bobi McGann |
13.38 | 81.19 |
| Palo Alto | Nancy Pettersen | 11.20 | 70.90 |
El Salto Arriba |
Rodrigo Marciacq |
6.25 | 39.63 |
| Valle Escondido | Doug Remsen | 9.41 | n/a |
Brisas Boquetenas |
Austin Perry |
20.40 | 100.40 |
| Brisas Boquetenas | Richard Sturtz | 29.60 | 114.81 |
Los Molinos |
Sela Burkholder |
18.67 | 88.80 |
| Los Molinos | Fred Donelson | 17.70 | 76.75 |
| El Encanto (Volcancito Rd) | Brian Baldwin | 9.50 | n/a |
Cerro Verde (Volcancito) |
Charlotte Lintz |
6.38 | 39.53 |
Santa Lucia |
Paula Litt |
12.75 | 62.59 |
| Caldera | Chris Mccall | 17.61 | n/a |
Lucero (Cielo Paraiso) |
Michael Mullin |
22.17 | 102.17 |
Boquete Country Club |
Paul Arrandale |
16.27 | 82.31 |
Palmira Abajo |
Betty Gray |
14.35 | 70.10 |
Palmira Arriba |
Lloyd Cripe |
14.21 | 63.34 |
n/a = not currently available but will be posted when available |
|||
We have a new contributor to the monthly rain data. Chris Mccall in Caldera is now on board and sending his data. We appreciate this new area added to our reports. He reports 17.61 inches of rain for the month of July.
There is a significant range in the inches of rain recorded around the district. The highest reported rainfall was again at Brisas Boquetenas as reported by Richard Sturtz with 29.60 inches. The lowest is again from El Santuario reported by Terry Zach with 2.95 inches.
You can check out the data over the past years for yourself. You can also look at the tables in the Climate Section to see what rains we have had in the month of July over the course of 14 years average about 12+ inches with considerable variation. The Palmira station is within the normal range for the month of July.
By the way, the equipment you use to measure rainfall can make a big difference. I highly recommend that you use quality equipment. The best inexpensive manual rain gauge that I can recommend is the Stratus Precision Rain Gauge which costs about $40.00. It is approved by the National Weather Service. I think the rain measuring equipment on most inexpensive weather stations are of questionable accuracy. It is usually a very inadequate rain measuring system for the rate and volume of rain that we get here in the tropics.
There is an old Chinese saying: "Why is there never enough time to do it right, but there is always enough time to do it over?" This is very true with weather measuring equipment. There used to be another saying, "You get what you pay for!" This is not always the case but it is generally true. I think cheap often gets cheap results!
I am in the process of checking out Terry Zach's rain collection system in El Santuario to make sure there is not a problem. His data is always considerably lower than others. He is very conscientious and dedicated to collecting the data but there may be a problem with the gauge size he uses and its location. We will be checking by installing another rain gauge of better quality in another location on his property to make comparisons between the 2 gauges. We will know by the end of the month what is needed and make necessary corrections. We will let you know what we discover.
Those of you who use automated weather stations need to periodically check the rain gauge by having a good quality manual gauge near by. Otherwise there really is no way of knowing if your station is correctly calibrated and giving an accurate report. You can't assume that because data collection is automatic, it is accurate. Automated weather stations need monitoring periodic calibration to be assured that the sensors are doing their job accurately. The big problem with inexpensive automated weather stations is how to you rest assured that they are accurate?
The latest ENSO Cycle Report is saying that "ENSO-neutral conditions are present. Equatorial sea surface temperatures (SSTs) are near-to-below average across the east-central and eastern Pacific Ocean. The tropical atmospheric circulation is consistent with ENSO-neutral. ENSO-neutral is favored to continue through the summer, with a 50-55% chance of La Niña development during Northern Hemisphere fall 2020 and continuing through winter 2020-21 (~50% chance)."
Here is a link to an excellent source for understanding El Niño. If you need some help with this, give this a read and you will learn a lot about this important weather phenomenon.
The IRI (International Research Institute for Climate and Society) (select South America from the Region menu) is predicting that Panama will probably have normal levels of precipitation for the months of August-September-October 2020 (white areas).
.gif)
ETESA's hydrology and meteorology section is predicting that Chiriqui will generally have above normal levels of precipitation in August of 2020. You can read their report and check out the details in the "documents" section at this link.
Last month, I mentioned the Saharan Air Layer and the reported appearance of some brown-yellow-orange clouds in the afternoon sky related to the layer. Various photos have shown up illustrating this phenomenon. I had not personally seen this.
On July 10 I got up at 06:30am to a most interesting sunrise. I had never seen the sky quite like this before although I have a number of sunrise photos from our upstairs balcony collected over the years. Here is what I saw:
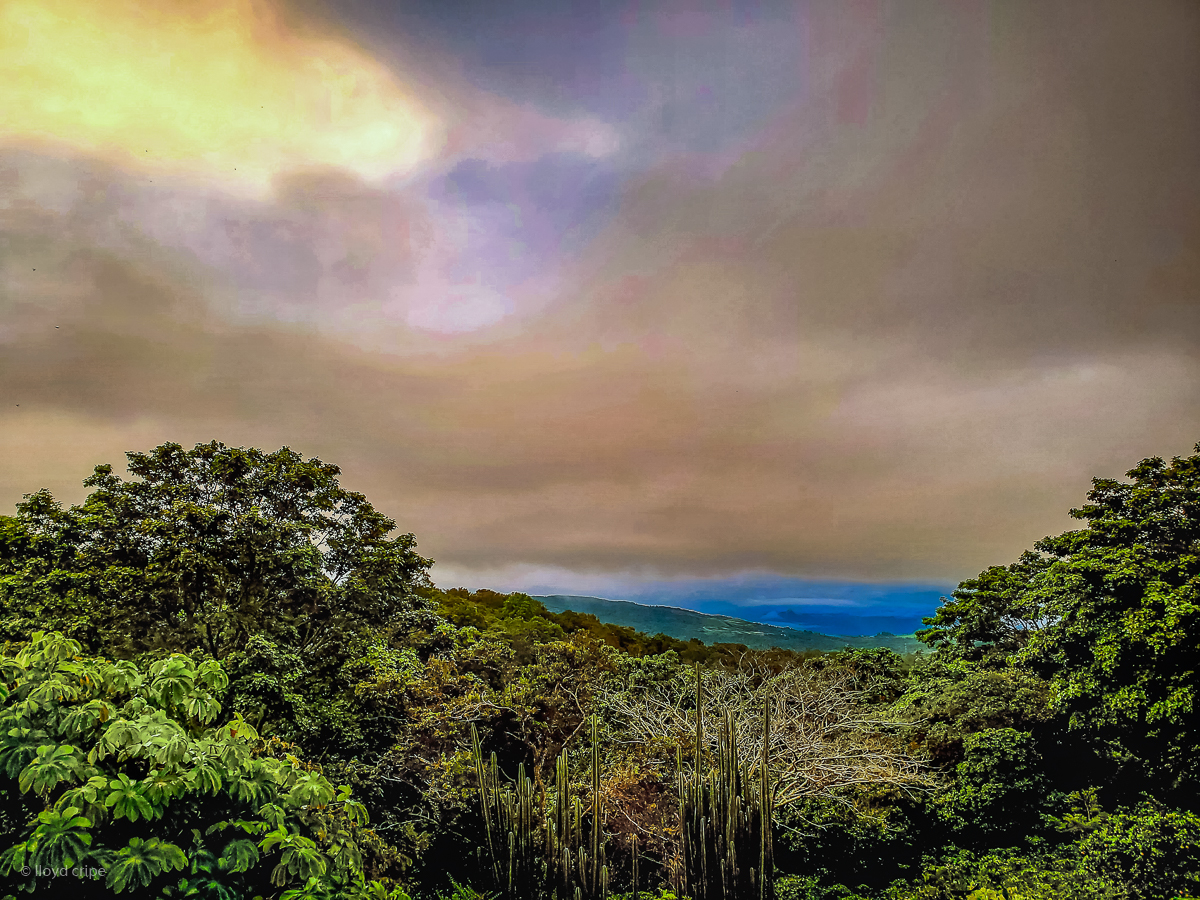
It was both beautiful and eerie.
Here is what I wrote last month about the Saharan Air Layer:
The SAL (Saharan Air Layer) is a dust cloud that comes from the Sahara Dessert multiple times each year. It starts from wind and sand storms over northern Africa and then is pushed by winds out over the Atlantic ocean rising above the cooler marine air. The trade winds push it westerly. Millions of tons of dust each year are transported in this manner effecting the Atlantic and many countries. It helps enrich the ocean and adds to tropical areas where soil quality is often very poor. It can have a calming effect on the development of hurricanes. The sand in the air can and does exacerbate allergies.
NOAA studies and monitors the SAL. Images of the status of the SAL are routinely published. You can read more about SAL here.
Here is a good article from The Atlantic regarding the recent giant dust cloud and the Saharan Air Layer in general. The Yale Climate Connections has another very informative article about it that is worth reading.
(You can read more of last months report here)
Here is what the NOAA image of the SAL at the time of the sunrise looked like:
.gif)
My experience with the unusual sunrise made the SAL a lot more meaningful. We don't have a good sunset view at our Palmira place but we are positioned for some spectacular sunrise views. Within 15+ minutes the sky had return to a more normal appearance.
The Pandemic continues. At the moment the worldometer reports 18,673,639 cases in the world with 702,953 deaths and 11,900,704 recovered cases. The USA has 4,915,823 cases with 160,215 deaths and 2,479,321 recovered cases. Panama has reported 68,456 cases of the virus and 1.497 deaths. That is a lot more sickness and deaths in the world since a month ago. We need to take all of this seriously and do all we can by our personal actions to prevent further suffering.
Remember, we may not be able to control the weather but we can control ourselves! Be mindful and wear a mask to protect yourself and others. It really is a simple but important matter. This is no time for orneriness, contrariness and generally rebellious behavior. We must think of others as-well-as ourselves. Get on board with cooperative behavior! An umbrella of protection is always worth it.
MONITORING CORONAVIRUS STATUS LINKS
Lloyd Cripe