| July 02, 2020 | No.135 |
June 2020
(Back Issues Here)
We had 19.02 inches of rain at the Palmira Station in June of 2020. The reports from around the District of Boquete for June generally indicate significant rain as expected for this phase of our rainy season.
Rainfall for June 2020 |
|||
Area |
Contributors |
June 2020 |
Total 2020 |
El Santuario |
Terry Zach |
8.67 | 28.35 |
Jaramillo Arriba |
Steve Sarner |
21.85 | 55.89 |
Jaramillo Abajo |
Don Berkowitz |
28.66 | 72.26 |
Jaramillo Abajo |
Bobi McGann |
29.34 | 67.81 |
| Palo Alto | Nancy Pettersen | 18.25 | 59.70 |
El Salto Arriba |
Rodrigo Marciacq |
9.58 | 33.38 |
| Valle Escondido | Doug Remsen | 17.57 | 45.31 |
Brisas Boquetenas |
Austin Perry |
37.40 | 80.00 |
| Brisas Boquetenas | Richard Sturtz | 41.07 | 85.21 |
Los Molinos |
Sela Burkholder |
27.91 | 70.13 |
| Los Molinos | Fred Donelson | 25.58 | 59.05 |
| El Encanto (Volcancito Rd) | Brian Baldwin | 17.90 | n/a |
Cerro Verde (Volcancito) |
Charlotte Lintz |
12.83 | 33.15 |
Santa Lucia |
Paula Litt |
19.61 | 49.84 |
Lucero (Cielo Paraiso) |
Michael Mullin |
30.65 | 80.00 |
Boquete Country Club |
Paul Arrandale |
25.30 | 66.04 |
Palmira Abajo |
Betty Gray |
18.63 | 55.75 |
Palmira Arriba |
Lloyd Cripe |
19.02 | 49.12 |
n/a = not currently available but will be posted when available |
|||
There is a significant range in inches recorded. The highest reported rain was at Brisas Boquetenas as reported by Richard Sturtz with 41.07 inches. The lowest is from El Santuario reported by Terry Zach with 8.67 inches.
You can check out the data over the past years for yourself. You can also look at the tables in the Climate Section to see what rains we have had in the month of June over the course of 14 years. The Palmira station is within the normal range for the month of June.
By the way, the equipment you use to measure rainfall can make a big difference. I highly recommend that you use quality equipment. The best inexpensive manual rain gauge that I can recommend is the Stratus Precision Rain Gauge which costs about $40.00. It is approved by the National Weather Service. I think the rain measuring equipment on most inexpensive weather stations are of questionable accuracy. It is usually a very inadequate rain measuring system for the rate and volume of rain that we get here in the tropics.
There is an old Chinese saying: "Why is there never enough time to do it right, but there is always enough time to do it over?" This is very true with weather measuring equipment. There used to be another saying, "You get what you pay for!" This is not always the case but it is generally true. I think cheap often gets cheap results!
The latest ENSO Cycle Report is saying that "ENSO-neutral conditions are present. Equatorial sea surface temperatures (SSTs) are near-to-below average across the east-central and eastern Pacific Ocean. The tropical atmospheric circulation is consistent with ENSO-neutral. There is a ~60% chance of ENSO-neutral during Northern Hemisphere summer 2020, with roughly equal chances (~40-50%) of La Niña or ENSO-neutral during the autumn and winter 2020-21."
Here is a link to an excellent source for understanding El Niño. If you need some help with this, give this a read and you will learn a lot about this important weather phenomenon.
The IRI (International Research Institute for Climate and Society) (select South America from the Region menu) is predicting that Panama will probably have above normal levels of precipitation for the months of July-August-September 2020 (green areas).
.gif)
ETESA's hydrology and meteorology section is predicting that Chiriqui will generally have above normal levels of precipitation in July of 2020. You can read their report and check out the details in the "documents" section at this link.
I was contacted last week about the unusual appearance of the clouds and sky in the afternoon. I was asked if this was related to the large dust cloud coming from Saharan Africa? It was predicted to be larger than normal and it was going to significantly affect the southern United States. Would it affect us here in Panama? The simple short answer was yes, it was having some effect on our skies but probably not as much as up north. The longer answer is the following:
The SAL (Saharan Air Layer) is a dust cloud that comes from the Sahara Dessert multiple times each year. It starts from wind and sand storms over northern Africa and then is pushed by winds out over the Atlantic ocean rising above the cooler marine air. The trade winds push it westerly. Millions of tons of dust each year are transported in this manner effecting the Atlantic and many countries. It helps enrich the ocean and adds to tropical areas where soil quality is often very poor. It can have a calming effect on the development of hurricanes. The sand in the air can and does exacerbate allergies.
NOAA studies and monitors the SAL. Images of the status of the SAL are routinely published. You can read more about SAL here.
Here is a good article from The Atlantic regarding the recent giant dust cloud and the Saharan Air Layer in general. The Yale Climate Connections has another very informative article about it that is worth reading.
The recent SAL was much larger than normal and was predicted to be a significant problem for the southern U.S.. NASA - NOAA described it as massive on June 18. A more recent NASA - NOAA article describes it in more detail. This Washington Post article will tell you more about the effects of the recent SAL over the U.S. and what is now expected.
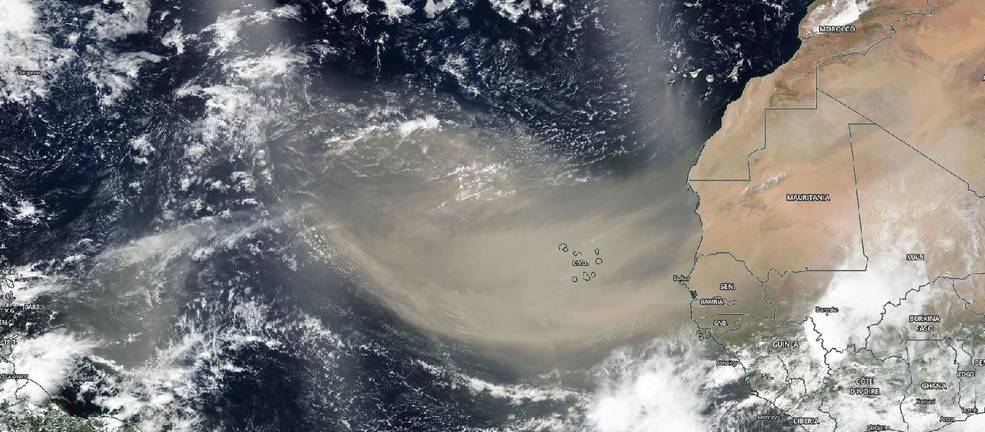
Here is what the early NASA visible image of the SAL looked like on 18 June 2020:
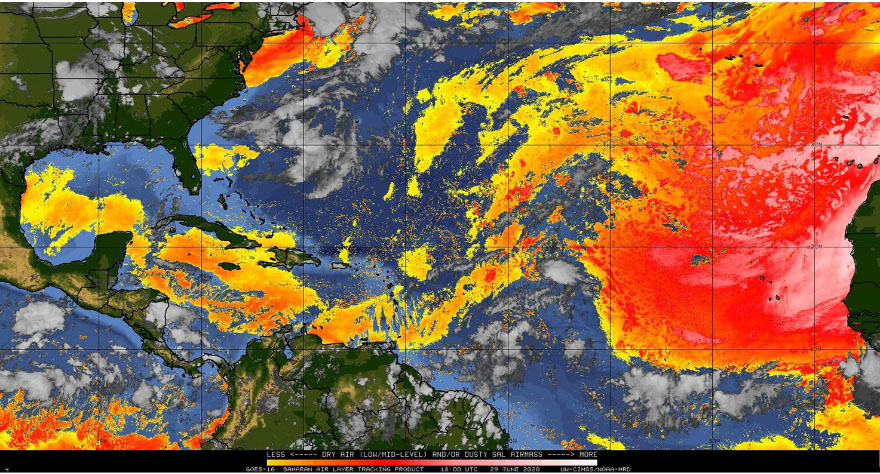
Here is a satellite image of SAL on June 29, 2020. Note that Panama is not directly in line with it.
This does not answer the question of how the SAL might effect us? Although I can't find any specific articles that answer the question, I think it will probably effect us less for the following reasons:
Our more southern location, the shape of masses and the path of the NE Trade Winds at higher elevations tends to prevent such cloud systems blowing so far south and hitting us directly. This is partly why we don't get hurricanes during the hurricane season.
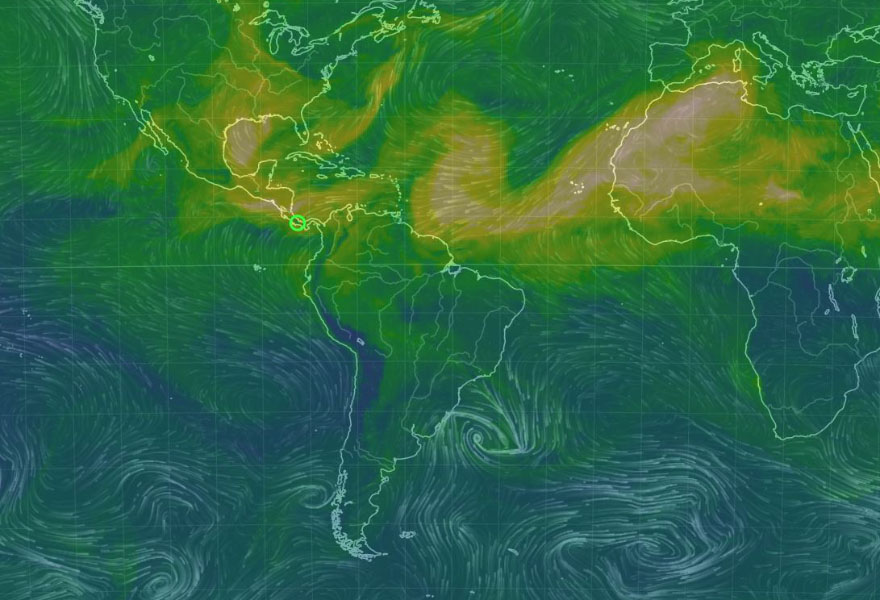
The Satellite image above and the graphic presentation below of the pattern of winds and particulates on July 1, 2020 taken from the Null School Earth website suggest this idea. Note how the flow of the particulates tend to bypass our area (green circle) due to land mass and winds. We may get some effects in our area but nothing like the hits taken by Brazil, Mexico and the southern U.S..
I want to share a couple of other news items that recently caught my interest:
The first news item is about some amazing videos summarizing 10 years of solar observations by NASA's Solar Dynamics Observatory. The most recent video is a 61 minute truly amazing video of images of the sun made from 10 years of ongoing observations. I think it is worth a complete viewing and mediation. Be sure to read the expanded information below the YouTube video to appreciate what you are watching. You might also go to the website to learn more about the project. Be sure that you go to full screen to view the video and listen to the video track music that was composed especially for it. You won't need sunscreen or any sunglasses for your protection as you watch it!
NASA's Solar Dynamics Observatory has also produced a 5 minute video of highlights of the 10 years of solar observations that is spectacular and well worth watching. Here is also a link to information about what they have learned over the 10 years of solar observations. Wow! Can you believe that this observation has happened in our lifetimes?
The second news item of interest is about lightning megaflashes. Living here, we are fully aware of lightning flashes that accompany some of our thunderstorms. We see the flash and a bit later we hear the roaring thunder. The flash time (usually brief) is related to the area the flash covers and the discharged electrical power. Can you imagine a lightning megaflash that lasted 16+ seconds? Read about it here. You can read WMO's (World Meteorological Organization) information about these megaflashes here.
Yes Paradise gets some lightning flashes but other places get more. While we get some thunderstorms here in the Boquete area, David gets a lot more as thunderstorms develop off the Pacific. Also, there are many places in the world (to include the U.S.) that get a lot more lightning flashes than we get here in Boquete. I have lived in areas that either get a lot more than we do here (Southern Alabama) and in places have almost no lightning (Seattle). If you are interested, here is a link to a website where you can observe lots of weather information (as real time as possible) to include lightning activity.
The Pandemic continues. At the moment the worldometer reports 10,927,861 cases in the world with 521,515 deaths and 6,107,194 recovered cases. The USA has had 2,811,200 cases with 131,175 deaths and 1,177,511 recovered cases. Panama has reported 34,463 cases of the virus and 645 deaths. That is a lot of sickness and deaths in the world. We need to take all of this seriously and do all we can by our personal actions to prevent further suffering.
Remember, we may not be able to control the weather but we can control ourselves!
MONITORING CORONAVIRUS STATUS LINKS
Lloyd Cripe