| Feb 3, 2023 | No.166 |
January 2023
(Back Issues Here)
We had 0.66 inches of rain at the Palmira Arriba Station in January of 2023. That is a little bit over a half an inch. Another dry month in the dry season but expected.
Rainfall for January 2023 |
|||
Area |
Contributors |
January 2023 |
Total 2023 |
| El Salto Arriba | Beth Corwin | 0.42 | 0.42 |
El Santuario |
Robert Boyd |
3.73 | 3.73 |
| El Santuario | Rodrigo Marciacq | 3.68 | 3.68 |
| Los Cabazon | Don Hughes | 2.27 | 2.27 |
Jaramillo Arriba |
Steve Sarner |
2.26 | 2.26 |
| Jaramillo Arriba | Mark Heyer | n/a | n/a |
| Jaramillo Central | Dave Nichols | n/a | N/A |
Jaramillo Abajo |
Don Berkowitz |
? | ? |
Jaramillo Abajo |
John McGann |
0.41 | 0.41 |
| Palo Alto | Nancy Pettersen | 7.61 | 7.61 |
| Valle Escondido | Gisela Remsen | 0.63 | 0.63 |
Brisas Boquetenas |
Austin Perry |
2.00 | 2.00 |
| Brisas Boquetenas | Dennis Decorte | 2.75 | 2.75 |
| Brisas Boquetenas | Richard Sturz | 1.84 | 1.84 |
Los Molinos |
Sela Burkholder |
3.82 | 3.82 |
| El Encanto (Volcancito) | Brian Baldwin | 0.90 | 0.90 |
Cerro Verde (Volcancito) |
Charlotte Lintz |
0.66 | 0.66 |
Santa Lucia |
Paula Litt |
0.62 | 0.62 |
| Caldera | Chris Mccall | 1.89 | 1.89 |
| Lucero | Mike Joy | 1.45 | 1.45 |
Boquete Country Club |
Paul Arrandale |
0.55 | 0.55 |
| Palmira Abajo | Andrea Boraine | 1.40 | 1.40 |
Palmira Arriba |
Lloyd Cripe |
0.66 | 0.66 |
| El Banco | Laura Daniels | ? | ? |
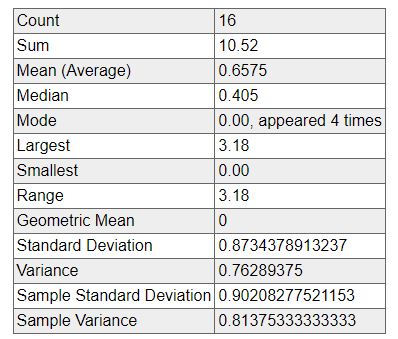
At the Palmira Arriba Station we recorded only 0.66 inches of rain for January. This is normal for the month of January. The average for the month of January observed over 16 years of data collecting is 0.66 inches with a standard deviation of 0.87 inches. The range has been between 0.00 to 3.18 inches.
Palmira Arriba Station January Rainfall over 16 Years
In the District of Boquete the rain for January 2023 was generally low with the highest reported by Nancy Pettersen at Palo Alto with 7.61. Note also some highs of 3+ inches in El Santuario. These are areas that typically receive more of the Bajareque precipitation that blows in over the mountains from the Caribbean. That results mean there will be more green in those areas during the dry season.
Take a look at this table to compare the amount of rain per month over the course of 16 years at the Palmira Arriba Station. You can check each month for yourself and see how the current month's data compares to other years. You can also look at the tables in the Climate Section to see what rains we had in various months over the course of the last 16 years as well as other weather variables.
The latest ENSO Cycle Report is saying that "La Niña is present. Equatorial sea surface temperatures (SSTs) are below average across most of the Pacific Ocean. The tropical Pacific atmosphere is consistent with La Niña. A transition from La Niña to ENSO-neutral is anticipated during the FebruaryApril 2023 season. By Northern Hemisphere spring (March-May 2023), the chance for ENSO-neutral is 82%."
Here is a link to a source for a better understanding of El Niño. If you need some help with this, give this a read and you will learn a lot about this important weather phenomenon. It has more effect upon the Northern Latitudes than it has upon us.
The IRI (International Research Institute for Climate and Society) (select South America from the Region menu) is predicting that Panama will have a dry season with limited precipitation during the months of February-March-April of 2023 (White).
.gif)
ETESA's hydrology and meteorology section is predicting that Chiriqui will have very little precipitation as we are in the annual dry season. You can read their report and check out the details in the "documents" section at this link.
Have you noticed the NE Winds? This is the season when we get the most wind. The average wind last month here at the Palmira Arriba station was 5.65 mph with a maximum of 28.9 mph. This is the result of higher pressures north of us in the Caribbean and Atlantic that wants to rush into lower pressure areas. Our area usually has relatively low pressure compared to the north. So we get the NE Trade Winds. You know, the winds that brought Columbus here many years ago. You can read more about this in my article on "Understanding Boquete Weather and Climate" in the Winds section.
If you haven't yet found and checked out the Windy website to monitor the winds of the world, you should take a look and add a bookmark to your browser. Another website that I have previously mentioned is the Nullschool Earth page. Amazing graphics of the earth's winds that can be set to various levels. While it isn't exactly real time data, it is as close as you can get. Both of these sites require a bit of study and effort to set them up, but worth it.
The United Surface Analysis chart gives a good overview of the current pressures and other weather data around the world. I check it each day. You can click on the chart over Panama and get a closer view of many weather variables in our area. You can also monitor the general location of the ITCZ which is a very low pressure area. Here is what the chart looks like right now:
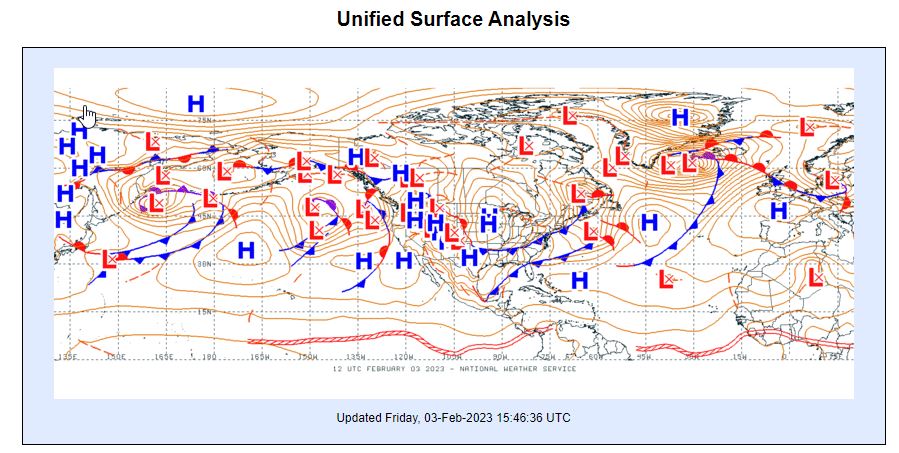
Note the big blue H's (high pressure areas) in the Caribbean and Atlantic areas and the red candy stripped ribbon (ITCZ) running over us. This mix of pressures is what powers the NE Trade Winds during our dry season.
Keep your umbrellas in a secure out of the wind place and your drones in their cases while the winds are howling. At the same time enjoy the sunshine and the lower humidity. Hopefully you have some extra water to share with those plants but not so much that your neighbors don't have any. Try to be mindful of the water challenges and play by the rules which is always a good idea.
Lloyd Cripe