| August 3, 2023 | No.172 |
July 2023
(Back Issues Here)
We had 10.26 inches of rain at the Palmira Arriba Station in July of 2023. It rained on 19 of the 31 days of the month.
Rainfall for July 2023 |
|||
Area |
Contributors |
July 2023 |
Total 2023 |
| El Salto Arriba | Beth Corwin | 16.98 | 58.62 |
| Alto Quiel | Robert Wareham | 10.35 | N/A |
El Santuario |
Robert Boyd |
8.70 | 49.05 |
| Palo Alto | Rodrigo Marciacq | 8.60 | N/A |
| Los Cabazon | Don Hughes | 9.37 | 49.03 |
Jaramillo Arriba |
Steve Sarner |
14.57 | 63.64 |
| Jaramillo Arriba | Mark Heyer | 8.55 | N/A |
| Palmira Abajo | Dave Nichols | N/A | N/A |
Jaramillo Abajo |
Don Berkowitz |
9.73 | N/A |
Jaramillo Abajo |
John McGann |
10.76 | 57.48 |
| Palo Alto | Nancy Pettersen | 9.97 | 58.72 |
| Palo Alto | Rodrigo Marciacq | 8.60 | N/A |
| Valle Escondido | Gisela Remsen | 7.94 | 39.91 |
Brisas Boquetenas |
Austin Perry |
N/A | N/A |
| Brisas Boquetenas | Dennis Decorte | N/A | N/A |
| Brisas Boquetenas | Richard Sturz | ?? | 67.40 |
| El Encanto (Volcancito) | Brian Baldwin | 9.07 | 45.92 |
Cerro Verde (Volcancito) |
Charlotte Lintz |
8.30 | 40.63 |
Santa Lucia |
Paula Litt |
5.15 | 39.81 |
| Caldera | Chris McCall | 10.16 | 62.17 |
| Lucero | Mike Joy | 11.99 | 84.14 |
Boquete Country Club |
Paul Arrandale |
10.33 | 60.42 |
| Palmira Abajo | Andrea Boraine | N/A | 61.60 |
Palmira Arriba |
Lloyd Cripe |
10.26 | 48.04 |
| N/A = Not Available | |||
Throughout the District of Boquete the rain for July 2023 varied between a high of 16.98 inches (El Salto Arriba) to a low of 7.94 inches (Valle Escondido). Check the table above to see which areas had the most and the least rain for the month.
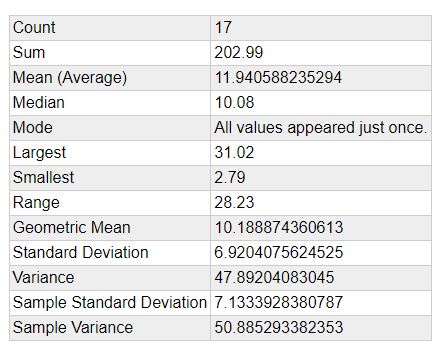
Digging back into the past data from the Palmira Arriba Station, the average rainfall for the month of July observed over 17 years of data collection is an average of 11.94 inches with a standard deviation of 6.92inches. During that span of time there was never a month of July without some rain. The range has varied between 2.79 to 31.02 inches. This month was a bit under average for July but less than a stardard deviation (0.24 sd). This is within normal ranges so I would say it was an avergae July month for rain.
Palmira Arriba Station July Rainfall over 17 Years
Take a look at this table to compare the amount of rain per month over the course of 17 years at the Palmira Arriba Station. You can check each month for yourself and see how the current month's data compares to other years. You can also look at the tables in the Climate Section to see what rains we had in various months over the course of the last 16 years as well as other weather variables.
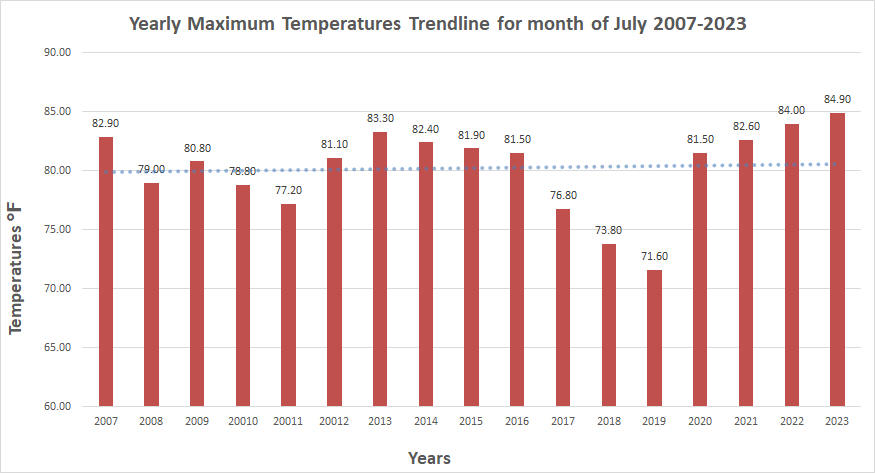
The average monthly temperature was 71.89 degrees Fahrenheit with a maximum of 84.9 degrees and a minimum of 61.7 degrees. At times, I thought it felt like we had some higher temperatures during the peak of the day. The graph below gives the maximum temperatures for the month of July over the course of 17 years of data collection at the Palmira Arriba Station. Is there a trend upward over these years?
A linear trendline applied to the data is depicted in this next graph. There is verly little indication of any trend upward. I have previously explained that you need 40+ years of data to sensibly start applying trend analysis so we don't really have enough data to safely apply the statistic.
Subjectively, it seems to me that we are at times getting some higher temperatures here in Boquete, but the data I have is not very impressively supporting this. I can only address our local area of Palmira Arriba since I don't have detailed data from all the areas in the District of Boquete.
Temperatures around the world have certainly been setting record highs. You have probably been hearing about this in the news. You can read more about this heat in seas and on land at this link to Climate Central information/news.
I also recommend taking a careful look and study of this article by Bob Henson at the Yale Climate Connections to better understand why we are breaking the heat records.
The latest ENSO Cycle Report is saying that "El Niño conditions are observed.* Equatorial sea surface temperatures (SSTs) are above average across the central and eastern Pacific Ocean. The tropical Pacific atmospheric anomalies are consistent with weak El Niño conditions. There is a greater than 90% chance that El Niño will continue through the Northern Hemisphere winter."
Checkout what the NASA Earth Observatory says about the return of El Niño conditions at this link.
Here is a link to a source for a better understanding of El Niño. If you need some help with this, give this a read and you will learn a lot about this important weather phenomenon. It has more effect upon the Northern Latitudes than it has upon us. From this article it appears that the effects on our area will be "warm and dry."
The IRI (International Research Institute for Climate and Society) (select South America from the Region menu) is predicting that Panama will have a 40% probability of below normal precipitation during the months of August-September-October of 2023 (Yellow).
.gif)
ETESA's hydrology and meteorology section is predicting that Chiriqui will continue to have moderately below normal levels of precipitation in August in the western part of Panama, but only slightly below normal in other parts of Panama. You can read their report and check out the details in the "documents" section at this link.
Now we can expand the use of our umbrellas to include not only protection from the rain, but also to provide some protection from the sun during the heat of the day!
Take care and try to avoid "heated arguments" over the weather and climate!
Lloyd Cripe