| Aug 3, 2022 | No.160 |
July 2022
(Back Issues Here)
We had 18.17 inches of rain at the Palmira Arriba Station in July of 2022.
Rainfall for July 2022 |
|||
Area |
Contributors |
July 2022 |
Total 2022 |
| El Salto Arriba | Beth Corwin | 14.21 | 67.67 |
El Santuario |
Robert Boyd |
12.93 | 81.39 |
| El Santuario | Rodrigo Marciacq | 9.74 | 75.66 |
| Barriade Las Flores | Bill Brick | 12.81 | 79.27 |
| Los Cabezos | Don Hughes | 15.56 | 93.43 |
Jaramillo Arriba |
Steve Sarner |
22.06 | 131.52 |
| Jaramillo Arriba | Mark Heyer | 17.91 | 95.50 |
| Jaramillo Central | Dave Nichols | 22.93 | 118.73 |
Jaramillo Abajo |
Don Berkowitz |
n/a | n/a |
Jaramillo Abajo |
John McGann |
22.20 | 120.23 |
| Palo Alto | Nancy Pettersen | 12.35 | 79.22 |
| Valle Escondido | Gisela Remsen | 13.38 | 67.56 |
Brisas Boquetenas |
Austin Perry |
35.00 | 137.08 |
| Brisas Boquetenas | Dennis DeCorte | 30.04 | n/a |
| Brisas Boquetenas | Richard Sturtz | n/a | n/a |
Los Molinos |
Sela Burkholder |
28.63 | 125.31 |
| El Encanto (Volcancito) | Brian Baldwin | 13.57 | 86.78 |
Cerro Verde (Volcancito) |
Charlotte Lintz |
11.25 | n/a |
Santa Lucia |
Paula Litt |
24.71 | 101.02 |
| Caldera | Chris Mccall | 26.63 | 139.40 |
| Lucero | Mike Joy | 31.23 | n/a |
Boquete Country Club |
Paul Arrandale |
18.14 | 92.81 |
| Palmira Abajo | Betty Gray | 18.29 | 97.55 |
Palmira Arriba |
Lloyd Cripe |
18.17 | 99.04 |
| El Banco | Laura Daniels | ? | n/a |
At the Palmira Arriba Station we recorded 18.17 inches of rain for July. This amount is high but not the highest I have recorded in the 16 years of data collection. In July of 2011, we recorded 22.96 inches. This table summarizes the rain data for the month of July from 2007 through 2022:
Palmira Arriba Station July Rainfall over 16 Years
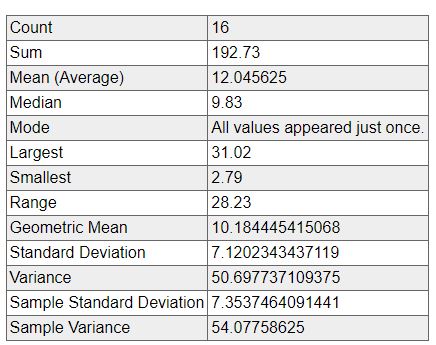
The average for the month of July from this data is 12.05 inches with a standard deviation of 7.12 inches. This months 18.17 inches is 0.86 standard deviations above the mean. So we had less than a standard deviation of rain in July as compared to other July data. It seemed to me like a lot less rain than we had in June (33.36 inches)!
Take a look at this table to compare the amount of rain per month over the course of 16 years at the Palmira Arriba Station. You can check each month for yourself and see how the current month falls compared to other years. You can also look at the tables in the Climate Section to see what rains we had in various months over the course of the last 16 years as well as check the other weather variables.
The reports from around the District of Boquete for July 2022 indicate various levels of rainfall.
The highest rainfalls was reported by Austin Perry at Brisas Boquetenas with 35.00 inches. Dennis DeCorte in the same area reported 30.04 inches. The lowest rainfall for the month was reported by Rodrigo Marciacq at El Santuario with 9.74 inches.
The latest ENSO Cycle Report is saying that "La Niña is present. Equatorial sea surface temperatures (SSTs) are below average across most of the Pacific Ocean. The tropical Pacific atmosphere is consistent with La Niña. La Niña is favored to continue through 2022 with the odds for La Niña decreasing into the Northern Hemisphere late summer (60% chance in July-September 2022) before increasing through the Northern Hemisphere fall and early winter 2022 (62-66% chance)."
Here is a link to a source for a better understanding El Niño. If you need some help with this, give this a read and you will learn a lot about this important weather phenomenon.
I also want to mention again an excellent understandable presentation about El Niño and the ENSO by Mel Strong in his Introduction to Weather and Climate Short Course available on YouTube. I highly recommend this presentation and the entire course to learn more about weather. If you listen to just the one lecture on El Niño, you will more clearly understand the ENSO (El Niño Southern Oscillation) system and how it generally affects world weather. He is an exceptional teacher and I find all his lectures in the course to be very informative and uniquely understandable.
The IRI (International Research Institute for Climate and Society) (select South America from the Region menu) is predicting that parts of Panama will have a 45 to 50% probability of above average levels of precipitation for the months of August-September-October 2022 (light to medium-green) while other parts will have normal levels (white).
.gif)
ETESA's hydrology and meteorology section is predicting that Chiriqui will have above normal levels of precipitation during August of 2022. You can read their report and check out the details in the "documents" section at this link.
You can watch a daily video report of Panama weather conditions at the ETESA website or on YouTube. Here is the link to their YouTube Channel. If you click the Subscribe button and the bell you get daily notifications of the report. You also get to practice your Spanish skills by watching it!
You may know that the U.S. has recently been experiencing some extreme weather conditions. High temperatures across the country are breaking many records. Lots of rain and flooding in some areas are breaking records. The central southern area of the U.S. was especially hard hit by excessive rain and flooding. This is probably more serious than we want to believe and is related to Climate Change which raises some serious questions about our future weather and even our survival. To better understand all of this, I highly recommend reading Jeff Masters article at the Yale Climate Connections website entitled: "The future of global catastrophic risk events from climate change."
The good news is that the WEBB Telescope is now busy doing research and capturing more incredible images of very deep space objects. Yesterday NASA presented an image from the WEBB Telescope of the Cartwheel Galaxy that will knock your socks off! Read about it here and then click on the image below to see a full resolution view of this amazing stellar object.

COVID INFORMATION
MONITORING CORONAVIRUS STATUS LINKS
COVID is still with us and will be for some time. At the moment the worldometer reports 583,349,868 cases of COVID worldwide with 6,422,576 deaths and 553,904,108 recovered cases. The USA has 93,225,110 total cases with 1,055,576 total deaths and 88,323,568 recovered cases.
Imagine 6,422,576 dead human beings in the world (most probably an underestimation) and 1,055,576 of the dead human beings are from the United States. While progress has been made in trying to control all of this, we are still not completely out of the woods with COVID.
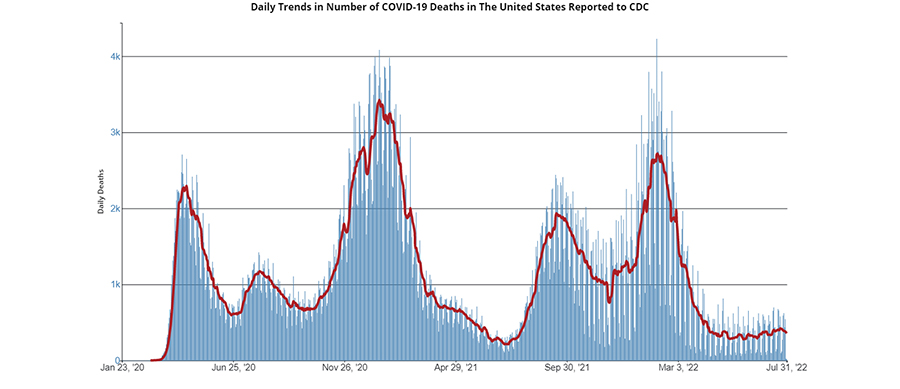
Although death rates are generally down (due mostly to vaccinations) there are still between 350-600 persons that die each day in the U.S. from COVID! Those who are vaccinated have less severe symptoms and a much less chance of death. Get vaccinated and take care to project yourself and others. I think during pandemics we need to cooperate and work together. It is a public health matter and not an individual matter of independence. Sometimes we just need to do what is best for the group and not be so damn contrary.
In many ways we are doing quite well here in the District of Boquete as compared to other parts of the world. We got through the month of July despite the demonstrations and strikes, road closures and some shortages of goods. Additionally we had plenty of rain to keep the rainforest green and the crops growing. Despite all the challenges we have a lot for which to be grateful. Most of all, we have the protection of those wonderful umbrellas!
Lloyd Cripe