| July 5, 2019 | No.123 |
June 2019
(Back Issues Here)
June 2019 delivered some rain to the Palmira Arriba Station but not as much as May. The reports from around the District of Boquete for June show considerable variability but generally lower levels than May:
Rainfall for June 2019 |
|||
Area |
Contributors |
June |
Total 2019 |
El Santuario |
Terry Zach |
7.42 | 33.91 |
Jaramillo Arriba |
Steve Sarner |
8.40 | 42.43 |
Jaramillo Abajo |
Don Berkowitz |
16.49 | 56.99 |
Jaramillo Abajo |
Bobi McGann |
13.46 | 46.84 |
El Salto Arriba |
Rodrigo Marciacq |
3.63 | 34.82 |
Brisas Boquetenas |
Austin Perry |
18.30 | 55.55 |
| Brisas Boquetenas | Richard Sturtz | 35.08 | 46.84 |
Los Molinos |
Sela Burkholder |
16.76 | 62.90 |
| Los Molinos | Fred Donelson | 13.25 | 57.84 |
Santa Lucia |
Paula Litt |
9.50 | 44.68 |
Lucero (Cielo Paraiso) |
Michael Mullin |
12.90 | 57.38 |
Cerro Verde |
Charlotte Lintz |
2.82 | 32.36 |
Boquete Country Club |
Paul Arrandale |
14.98 | 49.17 |
Palmira Abajo |
Betty Gray |
15.00 | 48.98 |
Palmira Arriba |
Lloyd Cripe |
9.91 |
39.59 |
n/a = not currently available but will be posted when available |
|||
Thanks again to all the volunteer rainfall data collectors. We appreciate your help to better understand micro rain climates in the Boquete District.
The monthly rainfall at our Palmira Arriba station was 9.91 inches. The lowest reported rainfall was at El Salto Arriba as reported by Rodrigo Marciacq with 3.63 inches. The highest reported was by Richard Sturtz at Brisas Boquetenas with 35.08 inches. Interestingly Austin Perry at Brisas reported 18.30 inches. Why so much difference? I don't know, but I do know there can be considerable variation within a short distance with the effects of thunderstorms.
Compared to the data for 13 previous years at our station, this month's rainfall is below average. The average is 17.44 inches for June. Check out the data over the past years. You can also look at the tables in the Climate Section to see what rains we have had in the month of May over the years.
The latest ENSO Cycle Report is now saying that "El Niño is present. Equatorial sea surface temperatures (SSTs) are above average across most of the Pacific Ocean. The pattern of anomalous convection and winds are generally consistent with El Niño. El Niño is predicted to persist through the Northern Hemisphere summer 2019 (66% chance), with lower odds of continuing through the fall and winter (50- 55% chance)."
Here is a link to an excellent source for understanding El Niño. Give it a read and you will learn a lot about this important weather phenomenon.
The IRI (International Research Institute for Climate and Society) (select South America from the Region menu) is reporting the following precipitation predictions for the months of July-August-September of 2019. Note the predictions of below normal precipitation for most of Panama (yellow to brown).
%20(Copy).gif)
ETESA's, hydrology and meteorology section is predicting that Chiriqui will have generally normal levels of precipitation in July of 2019 depending upon the specific area. You can read their June report and check out the details in the "documents" section at this link. They mention that May was the beginning of the rainy season.
The rainy season is here despite some lower rainfall in June. Interestingly, we often get less rain in June and July than in May.
In mid to late June and early July, there is often a variation of our wind direction and intensity falling between calm and windy. We often have a span of drier weather. This is known in Spanish as the "Veranito de San Juan" (the little summer of San Juan). You may be familiar with the term "Indian Summer" in the northern latitudes, a span of warm dry weather in the late fall. Although different dates, The Veranito de San Juan that occurs from mid to late June and into early July is a bit like an Indian Summer.
As I write this report today, there is significant wind coming from the Northeast, the sky is basically clear and it is dry. Here is the infrared satellite image:
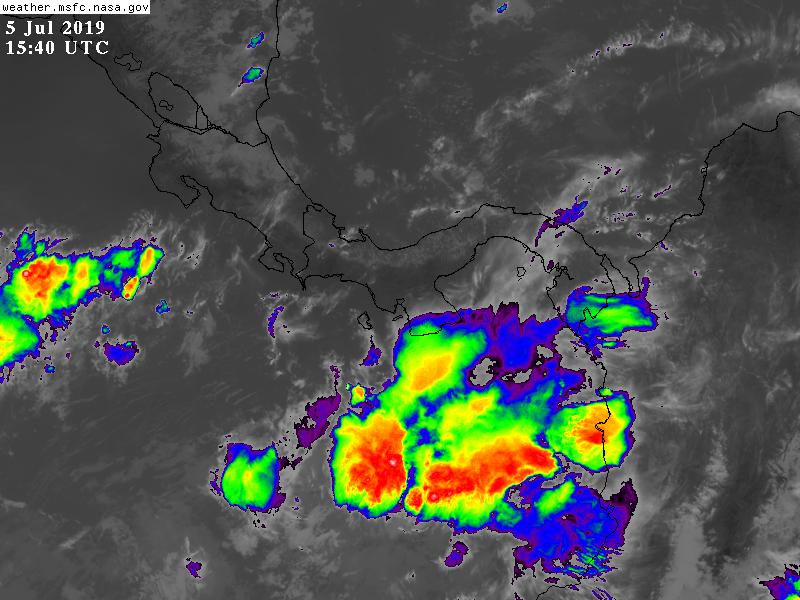
Note that our area is clear on the Pacific side as well as the Caribbean side. There are large clouds/moisture areas to our southeast and southwest. Let's now take a look at the unified surface analysis:
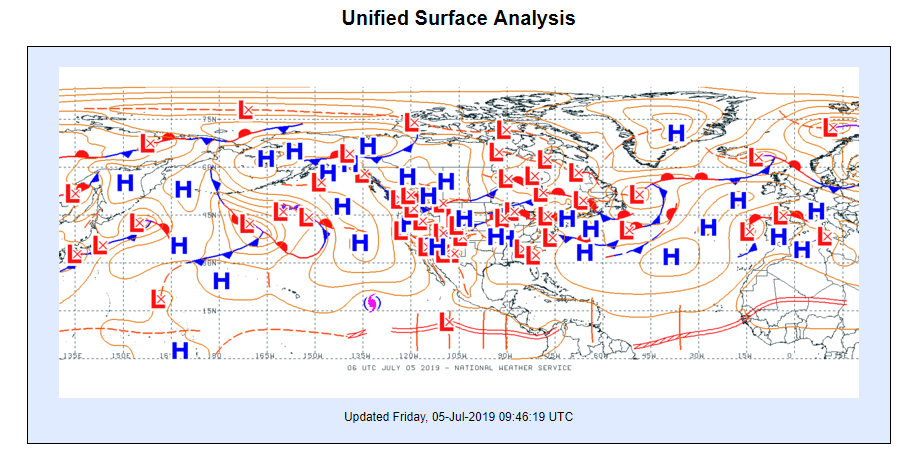
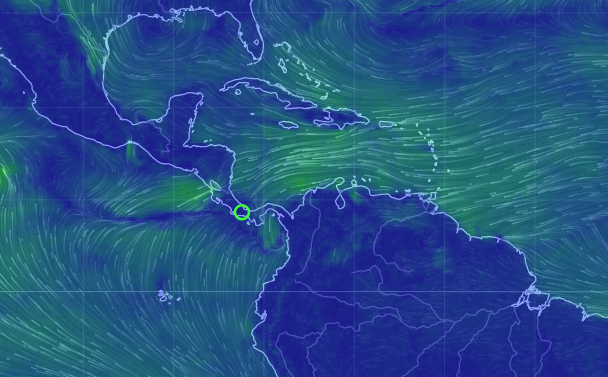
Note that the ITCZ (candy-striped red line) is below us. The ITCZ is the lowest pressure area. With the ITCZ in this position, the high pressure areas north of us in the Atlantic are driving NE trade winds into our area and keeping the rains from moving in from the south. Here is an image of the winds:
The ITCZ is not static and it moves over the course of the year. This graphic demonstrates the span of ITCZ north and south movement during the year:
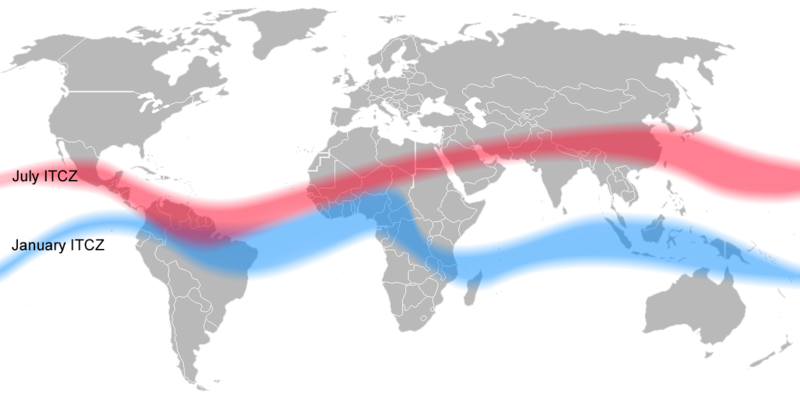
This time of the year, the ITCZ is gradually moving over and then north of us, but it varies day by day. It is this positioning of the ITCZ in mid June and early July that causes us to have varying winds and a drier weather, the so-called "Veranito de San Juan." It is called the Summer of Saint John because it happens near the eve of June 23 which is the religious celebration of Saint John the Baptist eve/day. It actually has nothing to do with Saint John nor does it always occur precisely on this particular day. I think it should be more appropriately called the "Dance of the ITCZ Days!"
Here is a link to a BBC webpage that will give you some more information about the ITCZ movement during the year.
Enjoy the "Little Summer of Saint John" but keep the umbrellas handy as it is an unpredictable and fleeting experience.
Lloyd Cripe
Again, I want to remind you that the Palmira Arriba weather station data is posted and available at Weather Underground as ICHIRIQU4. You can check out and review the Weather History by day, month or year at this website. For example, the tables indicate that on May 20th we had 4.68 inches of rain. There are tables and graphs. They even make some weather forecasts (I don't understand how!).